
Guides › Verification
Is the SONIC AI Track Record Real or Faked? Check It Yourself
A screenshot proves nothing — anyone can edit one. A live third-party tracking page is different: myfxbook pulls the numbers from the trading account itself, and neither TAG Markets nor the XFusion community can edit what it shows. Here are the numbers as of 20 August 2026, and the honest caveats attached to them.
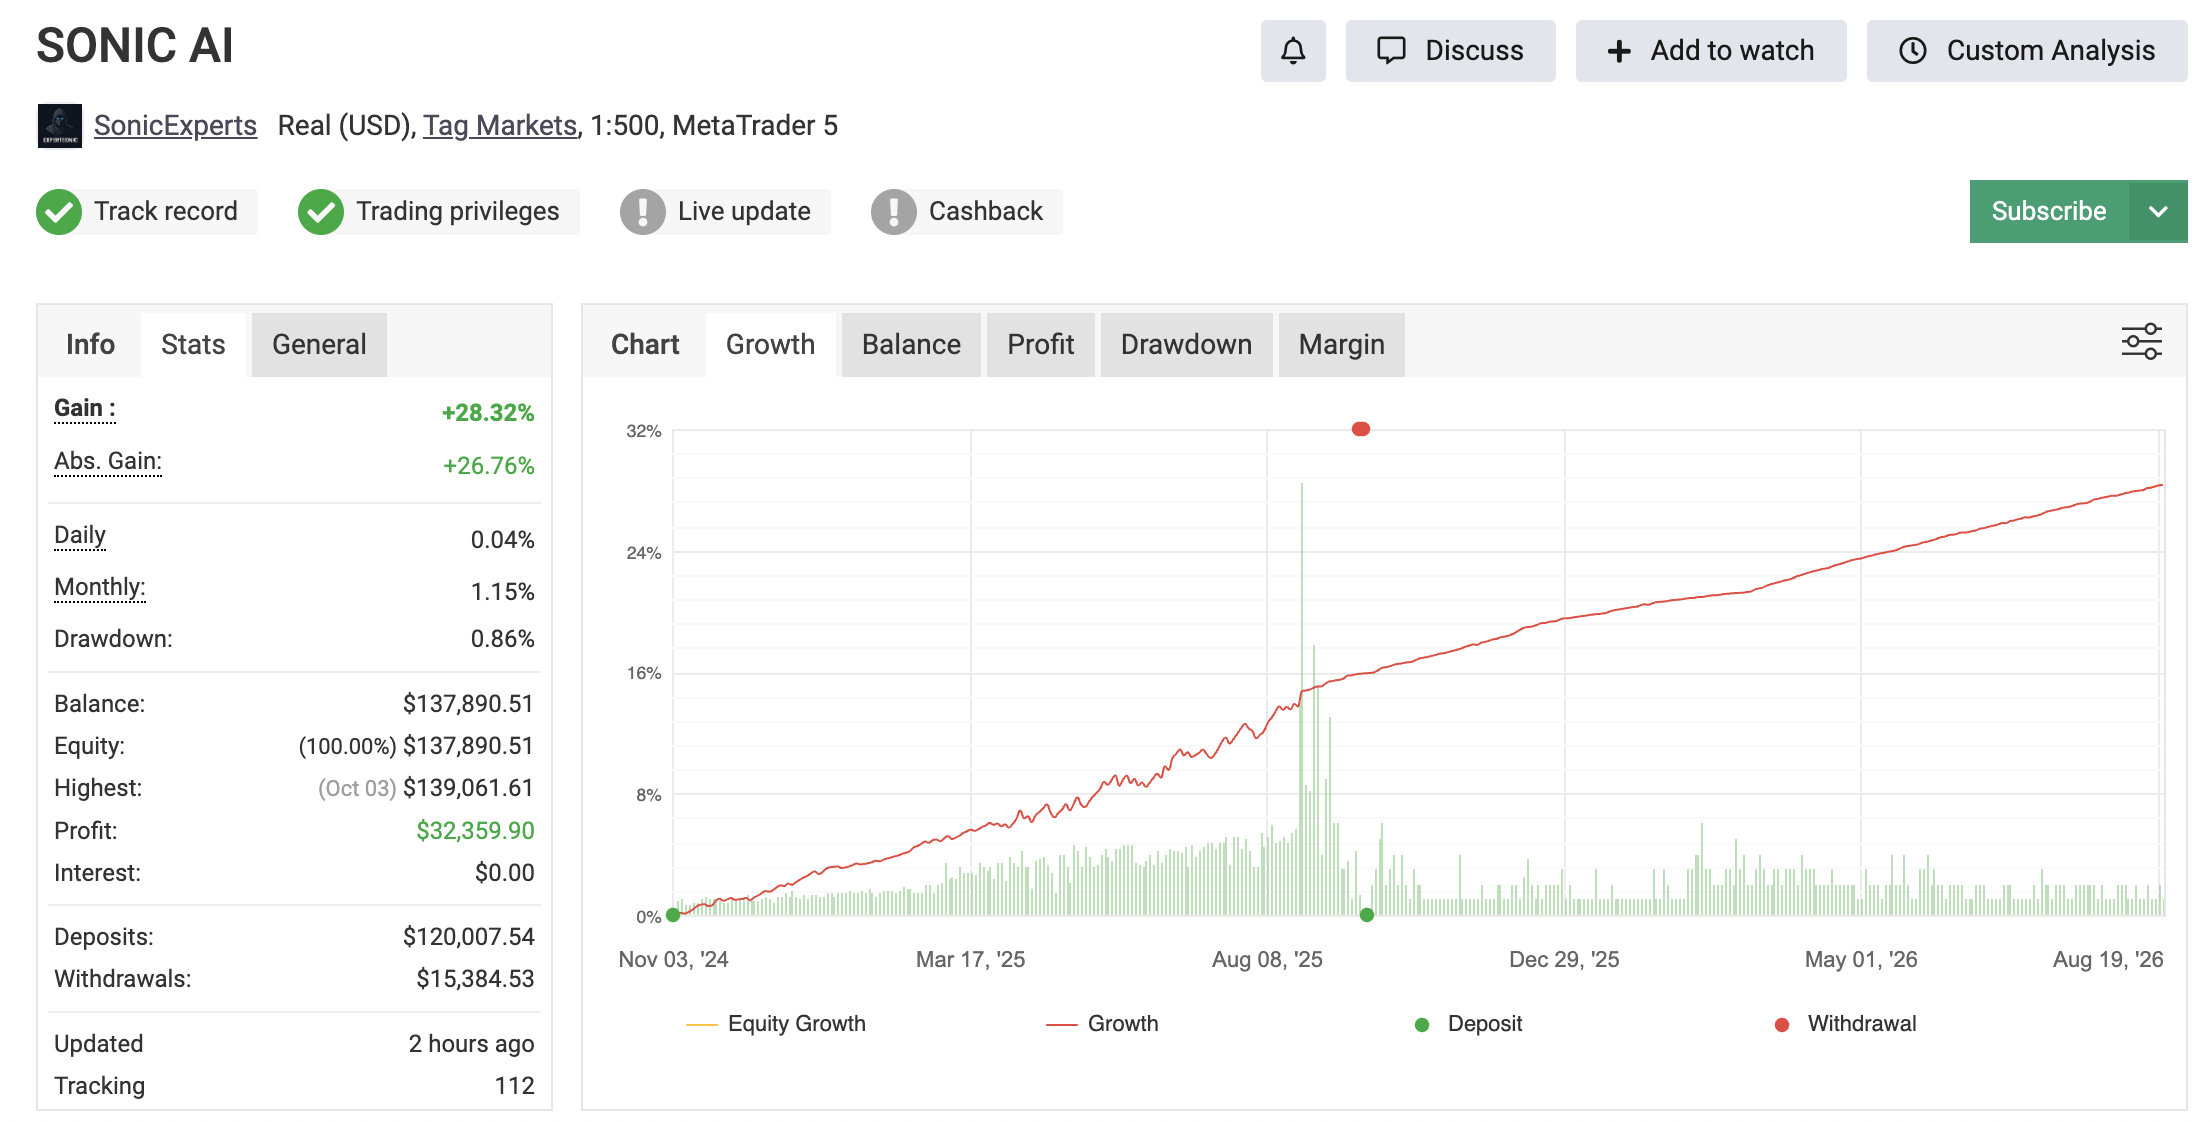
The numbers on the public page
Source: the SONIC AI account page on myfxbook, read on 20 August 2026. Numbers move — check the live page, do not trust this table.
| Metric | Value |
|---|---|
| Account type | Real (USD), Tag Markets, 1:500, MetaTrader 5 |
| Total gain | +28.32% (absolute gain +26.76%) |
| Average monthly | 1.15% |
| Maximum drawdown | 0.86% |
| 2026 year to date | +7.35% |
| History charted from | 3 November 2024 |
| Deposits / withdrawals | $120,007.54 in, $15,384.53 out |
| myfxbook badges | Track record ✔ verified · Trading privileges ✔ verified |
Those two green badges matter more than the percentage. Track record verified means myfxbook confirmed the account history through a read-only connection to the broker account rather than an upload. Trading privileges verified means the account is confirmed as a live trading account. Note also what is not lit up: "Live update" is grey, so the page refreshes on a schedule rather than continuously — the reading above showed "Updated 2 hours ago".
The withdrawal figure is worth reading too: $15,384.53 has come out of the account. Money leaving is a small but real signal, because a fabricated account rarely shows withdrawals.
Why a 0.86% drawdown is believable, not automatically fake
A very low maximum drawdown is a legitimate reason to look harder, because it is what a fabricated curve also looks like. Two things separate the two cases here.
First, the numbers are not self-published — they come from a third-party tracker reading the account. Second, and more usefully: a low drawdown is exactly what you would expect from a system that takes small, frequent, tightly-stopped positions rather than large directional bets. The trade log on the same page shows that pattern — many small trades, small pip gains, modest lot sizes. The trade-off is symmetric and unglamorous: small drawdowns come with small monthly returns. 1.15% a month is not a "get rich" number, and a system genuinely producing it will not suddenly produce 20%.
What would make it suspicious: a smooth equity line with no losing days at all, or returns far larger than the drawdown could plausibly support. Neither applies here.
Checked what you needed? Start with the $10 minimum, watch it trade, and test a withdrawal before you scale up.
Start NowThe three caveats promoters leave out
- Tracking start vs. history start. The equity chart runs from November 2024, but myfxbook has only been tracking for a fraction of that. History uploaded before tracking began is the broker statement’s version of events, not independently observed. The independently-observed window is shorter than the chart looks.
- The average hides the spread. "1.15% monthly" is an average over the whole record. 2026 year to date is +7.35% — roughly 0.9% a month, meaningfully below the headline. Monthly results genuinely vary, and a negative month is not excluded by anything in this record.
- This is one account, not your account. The tracked account runs at 1:500 with a six-figure balance. Your results differ with your leverage, your deposit size, when you start, spreads and slippage on your fills, and the performance fee taken from your profit.
How to check it yourself in five minutes
- Open the myfxbook page directly and confirm the broker shown is Tag Markets and the account type says Real, not Demo.
- Check the "Updated" timestamp. A live account updates within hours; a stale page means tracking stopped.
- Open the Monthly tab and read the worst month, not the best. That is your realistic expectation for a bad stretch.
- Open the Trading and History tabs and look at trade count and lot sizes — this is where a "smooth" curve with hidden 40% floating drawdown would show up as huge open positions.
- Note the drawdown figure and multiply it by your intended leverage before deciding what to deposit. See the leverage article.
Checked what you needed? Start with the $10 minimum, watch it trade, and test a withdrawal before you scale up.
Start NowThe sentence that has to be said
Past performance does not predict future results. A verified record tells you that a system did what it says it did up to today; it cannot tell you what it does next month. Verified past + real ongoing risk is the accurate description, and anyone shortening that to "verified, so it is safe" is selling you something.
Frequently asked questions
Is SONIC AI’s performance independently verified?
It is tracked on myfxbook, a third-party platform that reads the trading account directly. Note that history predating the tracking start date is imported from the account statement rather than independently observed.
What is SONIC AI’s maximum drawdown?
The public myfxbook page showed 0.86% maximum drawdown as of 20 August 2026. Check the live page for the current figure — and remember that a maximum drawdown is a historical record, not a limit.
Will I get 1.15% a month?
No one can promise that. 1.15% is the historical monthly average of one account; 2026 year to date runs closer to 0.9% a month, and losing months are possible.
Want to check something this page did not cover?
Send the question. If the answer is unflattering, you get the unflattering answer.
Ask me anythingOther resources
Independent information only — this site is not operated by, endorsed by, or affiliated with TAG Markets / T.M. Financials Ltd. Nothing here is financial advice. Opening an account through links on this site may earn the author a referral commission. Trading CFDs with leverage carries a high risk of loss; TAG Markets states that 85% of retail investor accounts lose money trading CFDs with them. Only risk money you can afford to lose entirely, and verify all figures at the primary sources linked in each article.